The Median Price Won't Tell You Where Your Money Goes Furthest in Urbandale, Clive, or Johnston
October 1, 2026
October 1, 2026
Urbandale has houses in nearly every price range, and that spread is also the reason the median price you see quoted for Urbandale, or for Clive, or for Johnston, is a much slipperier number than it looks.
Anyone comparing these four Des Moines-metro suburbs (Urbandale, Clive, Johnston, and Grimes) is doing the obvious thing: pulling up a median sale price for each city and treating it as a stand-in for what a typical home costs there. The problem is that in cities this size, a median isn't measuring a stable market. It's measuring whatever mix of homes happened to close in that particular window, and that mix can swing hard from one month to the next.
Start with Urbandale alone, before any cross-city comparison even happens. As of September 2026, Movoto's tracker put the city's median list price at $394,000, with a price per square foot of $229 and homes sitting on the market a median of 77 days, identical to the September 2025 figure. Zillow's own count, pulled as of June 30, 2026, showed the city's typical home value at $355,748, up just 0.6% year over year, with homes going pending in around 18 days. Redfin's December 2025 snapshot showed a median sale price of $385,000, up 10% year over year, with days on market at 58, down from 84 the year before.
Line those up and you get a city where homes supposedly sell in 18 days, 58 days, and 77 days, all within roughly the same year. None of the three trackers is wrong. They're pulling different months, measuring list price against sold price, and drawing from different slices of the same market. That gap between list-median ($394K) and recent sold-median ($385K) also hints that sellers are testing higher asks than the market is currently paying, at least in the specific homes that closed during that Redfin window.
The cross-city comparison gets stranger once Clive enters the picture. Clive's median sold price was roughly $357,500 in early 2026, with a price per square foot of $243, up 7.7% year over year. In that stretch, Clive's northwest corridor was the most active new-construction segment among the western suburbs, with six-bedroom builds regularly listed between $700,000 and $1.5 million and a handful of estate-scale listings above $2 million, sitting alongside condos priced under $200,000.
By August 2026, Movoto's tracker showed Clive's median sold price at $522,500, with 127 homes sold that month, up from 123 a year earlier, and days on market down slightly to 43. That's roughly a 46% jump in the reported median within about seven months. Homes in Clive did not get 46% more expensive over that span. What almost certainly happened is that August's closings included a heavier share of that northwest luxury corridor's finished builds. When a city's inventory spans condos under $200,000 and estates above $2 million, whichever segment happens to close in volume that month will drag the median toward it.
Johnston makes the same point from a different angle. Redfin's March 2026 data showed the city's median sale price at $386,000, down 7.5% year over year, but its days on market had fallen from 126 days a year earlier to just 29 days, and 26 homes sold that month compared to 19 the year before. Movoto's own March 2026 pull for the same city showed a median sold price of $412,945, with days on market at 105, up from 97, and 189 homes sold compared to 152 the year before.
Same city, same month, and the two trackers disagree not just on price but on whether homes were moving faster or slower than the year before. Redfin says the wait collapsed. Movoto says it stretched. The honest read is that neither number is a clean measure of "the Johnston market." Each is a measure of whatever subset of transactions that particular data provider captured.
Grimes shows why small sample size matters as much as mix. Redfin's January 2026 figures put the city's median sale price at $372,000, up 7.4% year over year, with a price per square foot of $245, up a striking 33.9% year over year. But that median was built from just 12 home sales that month, up from 10 the year before. Listings data updated September 17, 2026, showed a very different snapshot: 130 active listings, a median list price of $399,995, an average of 58 days on market, and an average price per square foot of $274.77.
Twelve closings is a small enough sample that one custom-built home or one modest starter sale can move the whole city's reported median by tens of thousands of dollars. That's not a flaw in Redfin's methodology. It's just what happens when you calculate a median from a dozen transactions instead of a hundred.
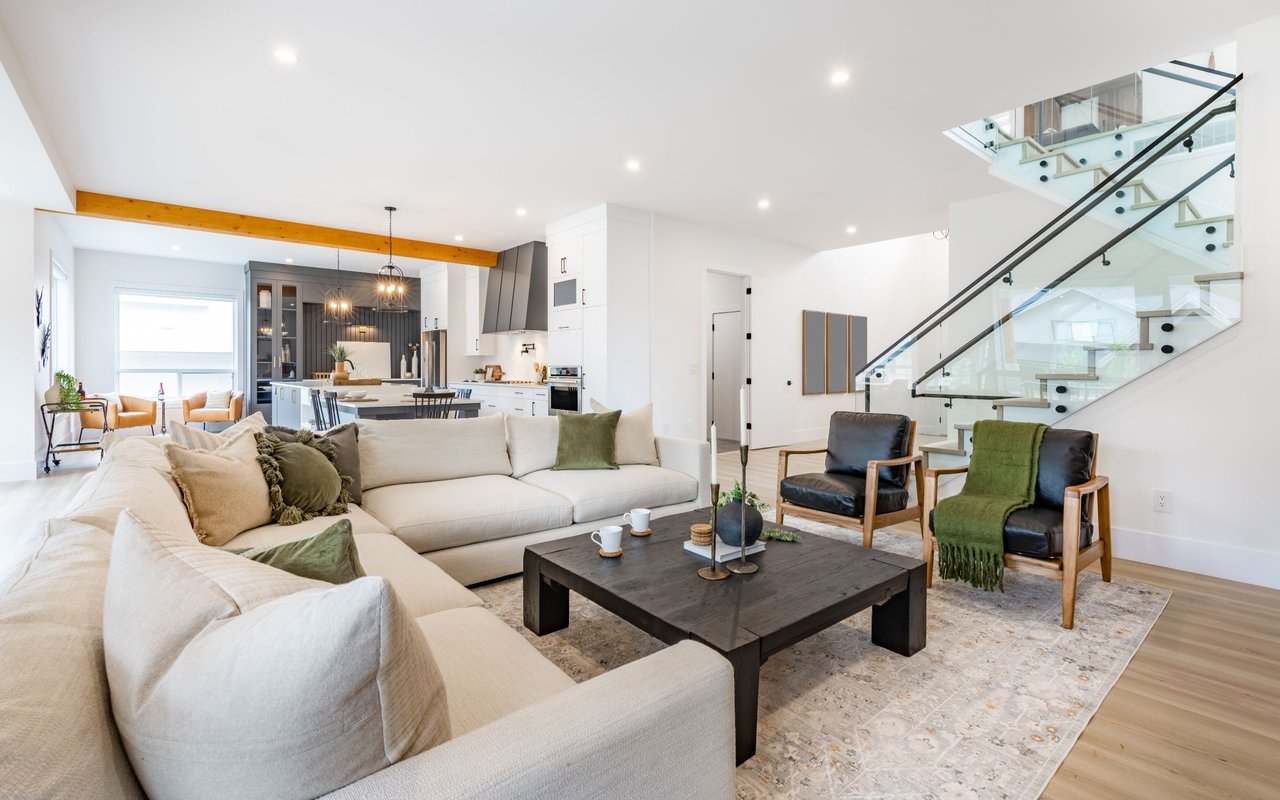
Urbandale's own price range makes more sense once you separate its older stock from its newest construction. Urbandale's city marketing office has described the older, more established section on the city's east side as homes largely built in the 1950s and 60s, on smaller lots along tree-lined streets, while newer development on the west side tends toward wider, more open streets. That older stock is where the wide price range starts: smaller, older starter homes on one end, running up against new construction in the northwest 50323 corridor at the other.
That northwest corridor is where builders like KRM Custom Homes are currently active, with developments including Bentley Ridge, a community of bi-attached villas on lots backing to trees, Biltmore Proper along Meredith Drive, Biltmore West's second plat with pond-view lots, and Bent Tree Crossing, which still has walkout lots available near parks and recreation areas. New construction in that corridor is a meaningful part of why Urbandale's price per square foot has climbed 7.6% to 10.8% year over year across different trackers, even while the city's broader home-value index has only inched up 0.6% to 1.6%. The per-square-foot number is catching a shift toward smaller, newer, pricier-per-foot product. The value index, built to track typical homes across the whole city, is moving much more slowly because most of Urbandale's housing stock isn't new construction at all.
None of this means median price is useless. It means a single month's median, for a single city, from a single source, isn't a number sturdy enough to carry a decision about where to buy. Three things travel better across cities and across trackers.
Price per square foot, tracked over a full year rather than one month, normalizes for the fact that a city's closings might be smaller homes this month and larger ones next month. Days on market, compared to the same month a year earlier rather than to a different city's number, shows whether pace is genuinely shifting rather than just reflecting a different data provider's sample. And the raw count of homes sold matters more than most buyers assume. A city with 12 sales in a month will always look noisier than one with 130, no matter how good the tracker is.
The cleanest way to compare Urbandale against Clive, Johnston, or Grimes for a specific budget and timeline is to pull same-period MLS data across all four at once, rather than stacking together snapshots taken months apart from different sources. That's a conversation, not a spreadsheet you can build from a portal search.
Does a lower median price always mean a better deal? Not necessarily. A lower median can simply reflect a batch of smaller or older homes closing that month rather than lower prices for comparable square footage and finish level. Price per square foot is the better apples-to-apples check.
Why do Zillow, Redfin, and Movoto show different numbers for the same city? They pull data on different schedules, some track list price and others track sold price, and each draws from a different underlying sample. Treat any single tracker's monthly figure as one data point rather than the whole picture.
How many sales does it take before a city's median is reliable? There's no fixed threshold, but a city with a dozen or two closings in a month will swing much more than one with over a hundred. Weight the number accordingly, and ask what the sample size actually was before comparing it to a neighboring city.
If you're weighing Urbandale against Clive, Johnston, or Grimes and want the same-period numbers pulled side by side instead of stitched together from three different trackers, Laura Major can walk through what the current data actually means for your budget and timeline. Let's Connect.
October 1, 2026
September 24, 2026
September 17, 2026
September 10, 2026
September 3, 2026
August 27, 2026
August 20, 2026
August 13, 2026
August 13, 2026
Every home has a story, and every client deserves a strategy that's uniquely their own. With dedicated guidance, market insight, and a commitment to exceptional service, you'll have the support you need to achieve the best possible outcome.